Anjul Sahu
Logging in Kubernetes: EFK vs PLG Stack
With ever-increasing complexity in distributed systems and growing cloud-native solutions, monitoring and observability become a very important aspect in understanding how the systems are behaving. There is a need for scalable tools that can collect data from all the services and provide the engineers with a unified view of performance, errors, logs, and availability of components. These tools also need to be cost-effective and performant. In this article, we will go through two popular stacks for logging in Kubernetes – EFK (Elasticsearch) and PLG (Loki) and understand their architecture and differences.
What is EFK Stack?
You might have heard of ELK or EFK stack which has been very popular. It is a set of monitoring tools – Elastic search (object store), Logstash or FluentD (log routing and aggregation), and Kibana for visualization.
A typical workflow would be like the following:
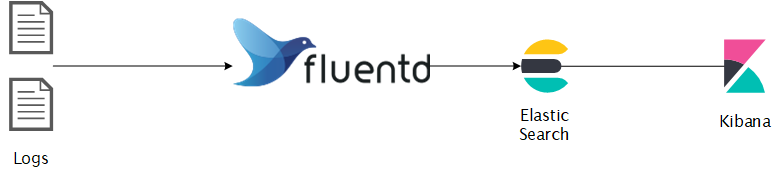
(Typical EFK Workflow)
Elasticsearch is a real-time, distributed object storage, search and analytics engine. It excels in indexing semi-structured data such as logs. The information is serialized as JSON documents and indexed in real-time and distributed across nodes in the cluster. Elasticsearch uses an inverted index which lists all unique words and their related documents for full-text search, which is based on Apache Lucene search engine library.
FluentD is a data collector which unifies the data collection and consumption for better use. It tries to structure data as JSON as much as possible. It has plugin-architecture and supported by 100s of community provided plugins for many use-cases.
Kibana is the visualization engine for elasticsearch data, with features like time-series analysis, machine learning, graph and location analysis.
Elasticsearch Architecture
Typically in an elastic search cluster, the data stored in shards across the nodes. The cluster consists of many nodes to improve availability and resiliency. Any node is capable to perform all the roles but in a large scale deployment, nodes can be assigned specific duties.
There are following type of nodes in the cluster:
- Master Nodes – controls the cluster, requires a minimum of 3, one is active at all times
- Data Nodes – to hold index data and perform data-related tasks
- Ingest Nodes – used for ingest pipelines to transform and enrich the data before indexing
- Coordinating Nodes – to route requests, handle search reduce phase, coordinates bulk indexing
- Alerting Nodes – to run alerting jobs
- Machine Learning Nodes – to run machine learning jobs
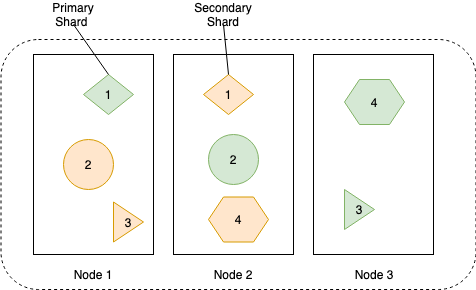
Below diagram shows how the data is stored in primary and replica shards to spread the load across nodes and to improve data availability.
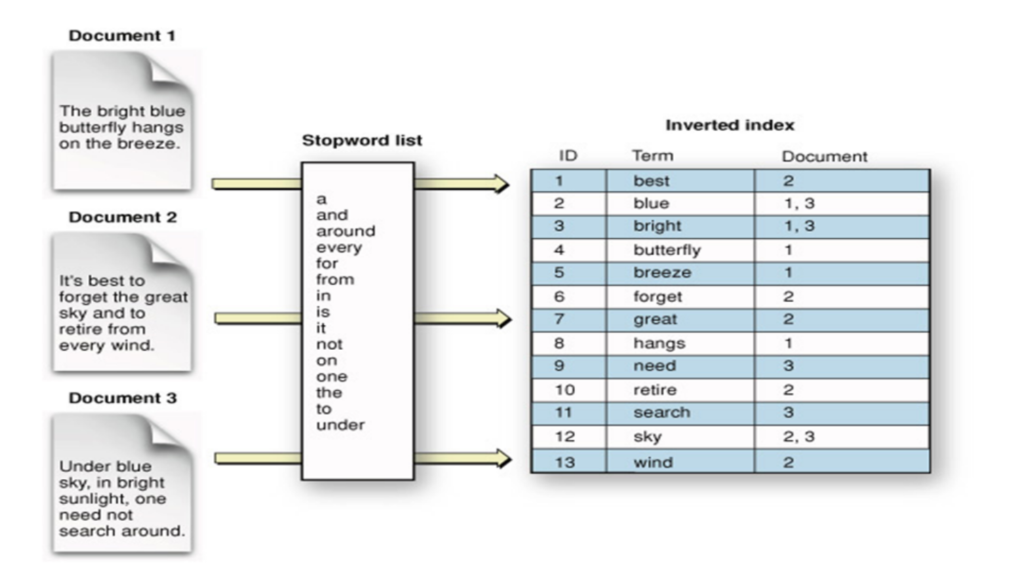
The data in each shard is stored in an inverted index. Below figure shows how the data would be stored in an inverted index.
EFK Stack – Quick Installation
For the detailed steps, I found a good article on DigitalOcean. Here, I am installing using helm chart in my demo.
Quickstart:
$ helm install efk-stack stable/elastic-stack --set logstash.enabled=false --set fluentd.enabled=true --set fluentd-elasticsearch.enabled=true
What is PLG Stack (Promtail, Loki and Grafana)?
Don’t be surprised if you don’t find this acronym, it is mostly known as Grafana Loki. Anyway, this stack is getting good popularity due to its opinionated design decisions. You might know about Grafana which is a popular visualization tool. Grafana labs designed Loki which is a horizontally scalable, highly available, multi-tenant log aggregation system inspired by Prometheus. It indexes only metadata and doesn’t index the content of the log. This design decision makes it very cost-effective and easy to operate.
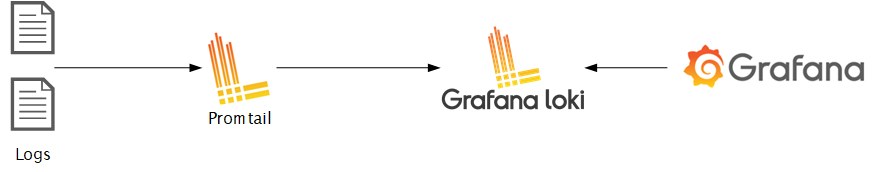
Promtail is an agent that ships the logs from the local system to the Loki cluster.
Grafana is the visualization tool which consumes data from Loki data sources.
The Loki is built on the same design principles of Prometheus, therefore it is a good fit for storing and analyzing the logs of Kubernetes.
Loki Architecture
Loki can be run in single-process mode or in multiple process mode providing independent horizontal scalability.
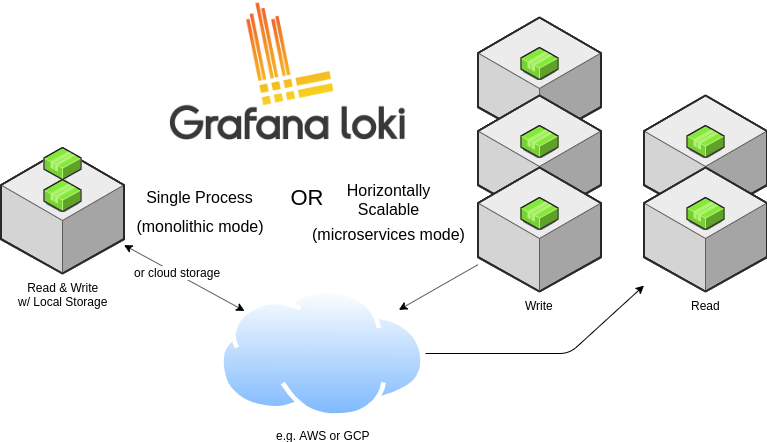
Loki is designed in a way that it can be used as a single monolith or can be used as microservice. The single-process model is good for local development and small monitoring setup. For production and scalable workload, it is recommended to go with the microservices model. The write path and read path in Loki are decoupled so it is highly tuneable and can be scaled independently based on the need.
Let’s look into its logging architecture at high level with below diagram.
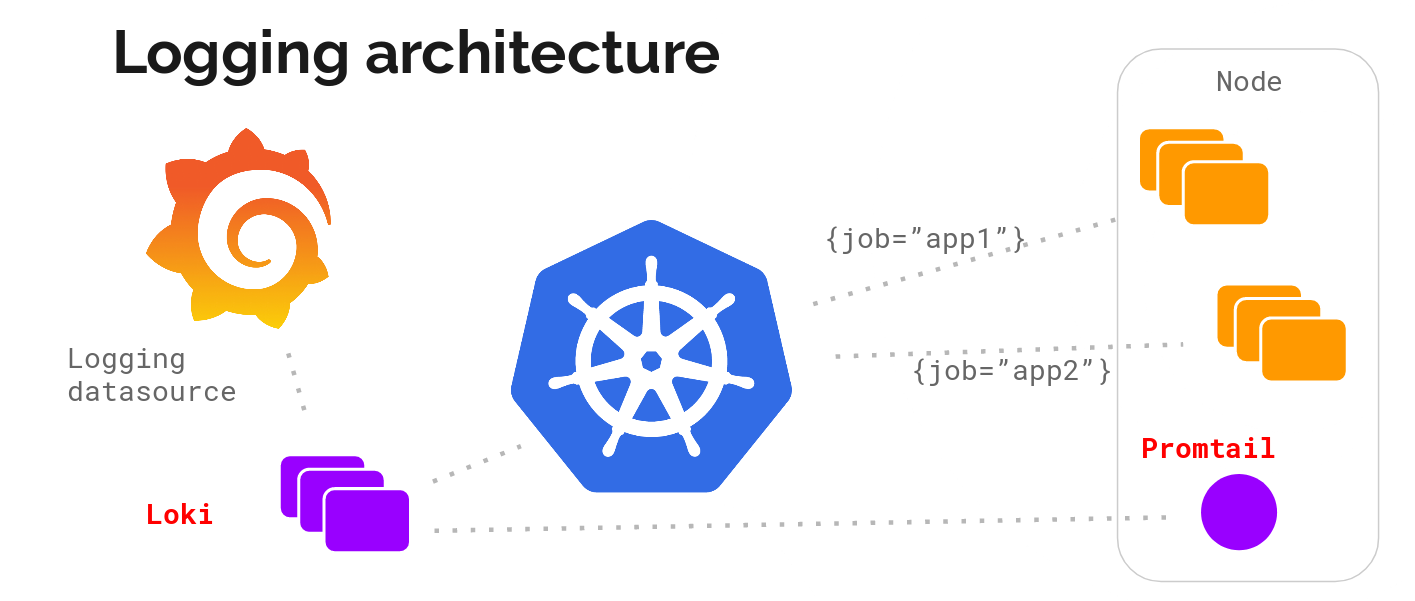
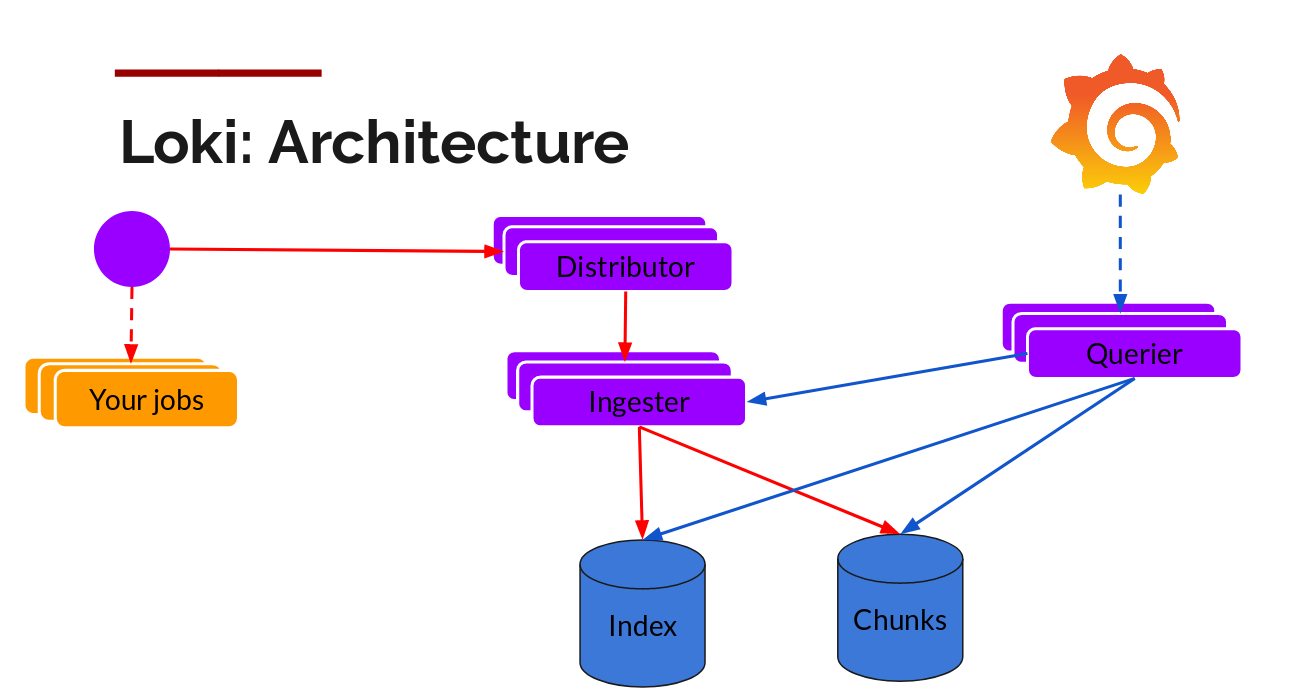
Below is the breakdown of the Loki (Microservice model).
Components
Promtail – This is the agent which is installed on the nodes (as Daemonset), it pulls the logs from the jobs and talks to Kubernetes API server to get the metadata and use this information to tag the logs. Then it forwards the log to Loki central service. The agents support the same labelling rules as Prometheus to make sure the metadata matches.
Distributor – Promtail sends logs to the distributor which acts as a buffer. To handle millions of writes, it batches the inflow and compresses it in chunks as they come in. There are multiple ingesters, the logs belonging to each stream would end up in the same ingester for all relevant entries in the same chunk. This is done using the ring of ingesters and consistent hashing. To provide resiliency and redundancy, it does n (default 3) times.
Ingester – As the chunks come in, they are gzipped and appended with logs. Once the chunk fills up, the chunk is flushed to the database. The metadata goes into Index and log chunk data goes into Chunks (usually an Object store). After flushing, ingester creates a new chunk and add new entries in to that.
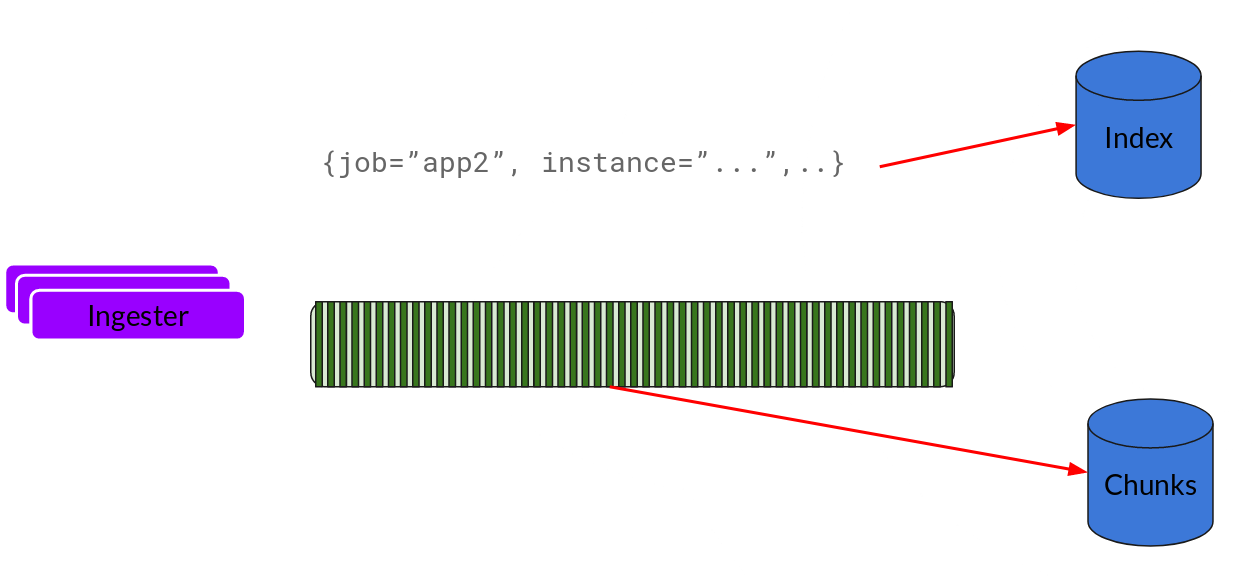
Index – Index is the database like DynamoDB, Cassandra, Google Bigtable, etc.
Chunks – Chunk of logs in a compressed format is stored in the object stores like S3
Querier – This is in the read path and does all the heavy lifting. Given the time range and label selector, it looks at the index to figure out which are the matching chunks. Then it reads through those chunks and greps for the result.
Now let’s see it in action.
To install in Kubernetes, the easiest way is to use helm. Assuming that you have helm installed and configured.
Add the Loki chart repository and install the Loki stack.
$ helm repo add loki https://grafana.github.io/loki/charts
$ helm repo update
$ helm upgrade --install loki loki/loki-stack --set grafana.enabled=true,prometheus.enabled=true,prometheus.alertmanager.persistentVolume.enabled=false,prometheus.server.persistentVolume.enabled=false
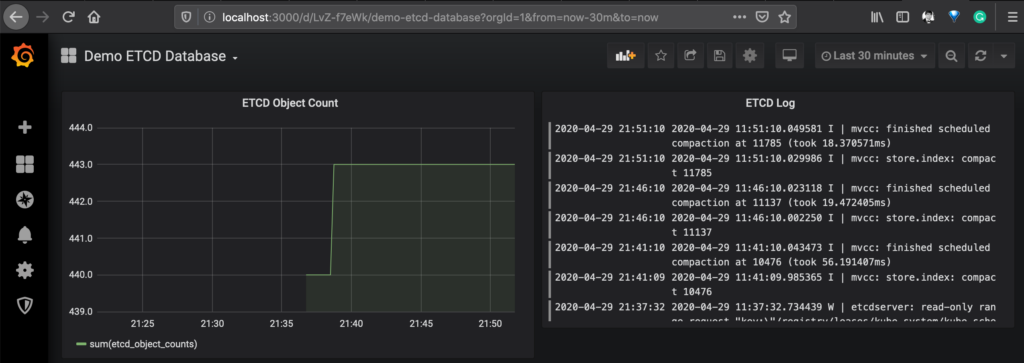
Below is a sample dashboard showing the data from Prometheus for ETCD metrics and Loki for ETCD pod logs.
Now we have discussed the architecture of both logging technologies, let’s see how they compare against each other.
Comparison of EFK (Elasticsearch) vs PLG (Loki) Stack:
Query Language
Elasticsearch uses Query DSL and Lucene query language which provides full-text search capability. It is a mature powerful search engine with extensive operator support. It can search in the content and sort it using a relevance score. On the other side, Loki uses LogQL which is inspired my PromQL (Prometheus query language). It uses log labels for filtering and selecting the log data. You can use some operators and arithmetic as documented here but it is not mature like Elastic language.
Combined with the labels information, the queries in Loki are simple for operational monitoring and can be correlated with metrics easily.
Scalability
Both are horizontally scalable but Loki has more advantages because of its decoupled read and write path and use of microservices-based architecture. It can be customized as per your specific needs and can be used to consume a very large amount of logging data.
Multi-tenancy
Having multiple tenants in a shared cluster is a common theme to reduce OPEX. Both technologies provide ways to host multiple tenants. With elasticsearch, there are various ways to keep the tenants separate – one index per tenant, tenant-based routing, using unique tenant fields, and use of search filters.
In Loki, the multi-tenancy is supported by using X-Scope-OrgId in the HTTP header request.
Cost
Loki is an extremely cost-effective solution because of the design decision to avoid indexing the actual log data. Only metadata is indexed and thus it saves on the storage and memory (cache). The object storage is cheaper as compared to the block storage required by Elasticsearch clusters.
Conclusion
EFK stack can be used for a variety of purposes, providing the utmost flexibility and feature-rich Kibana UI for analytics, visualization, and querying. It is equipped with machine learning capabilities.
Loki Stack is useful in Kubernetes ecosystem because of the metadata discovery mechanism. One can easily correlate the time-series based data in grafana and logs for observability.
When it is a matter of cost and storing logs for a long amount of time, Loki is a great choice for logging in cloud-native solutions.
There are more alternatives in the market which may be better for you. For example, in GKE, Stackdriver is integrated and provides a great observability solution. We haven’t included those in our analysis in this post.
Enjoyed the post? Do share your thoughts. Let’s connect on Twitter and start a conversation @anjuls.